
Resume & Portfolio
Senior year Data Analytics Major | President of Data Analytics Student Association | Division 1 Swimmer | Queens Univeristy of Charlotte
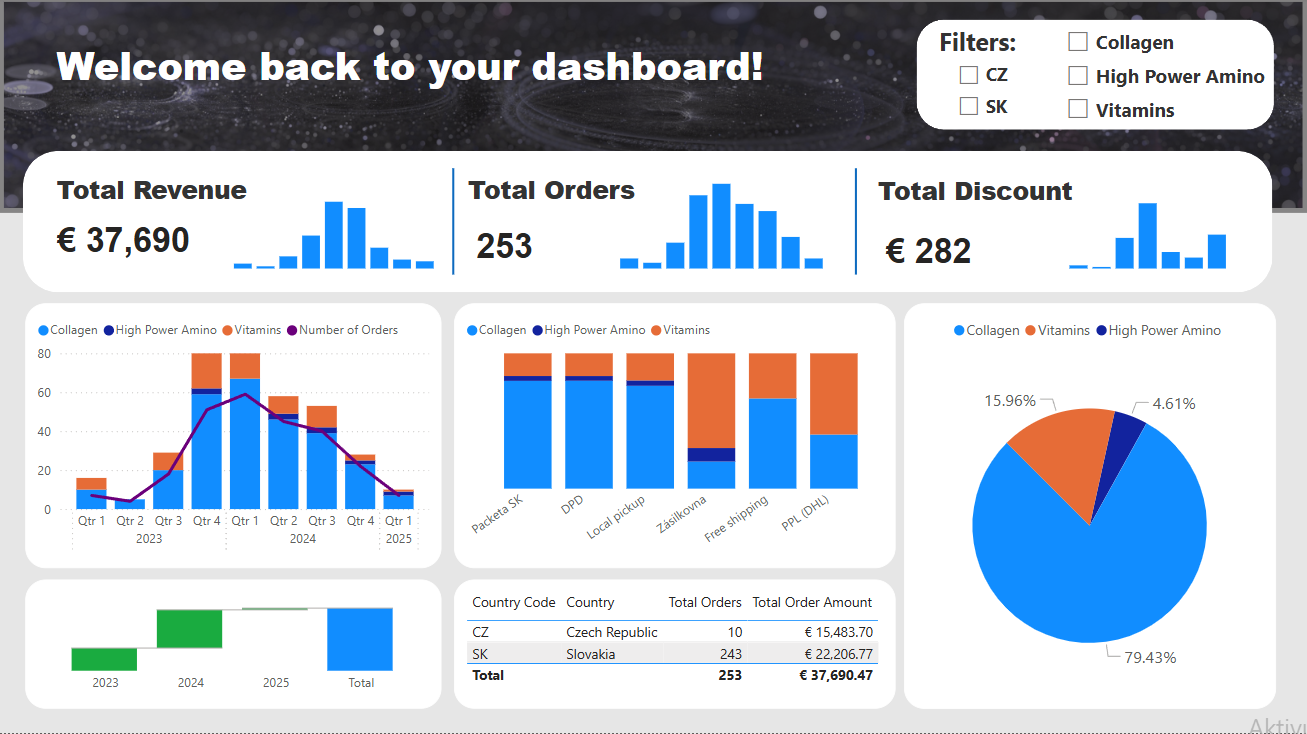
E-commerce Sales Analysis and Visualization Using Power BI and Python
Project Overview
This project focuses on analyzing and visualizing e-commerce sales data using SQL, Python and Power BI. The goal was to clean, process, and analyze sales data from different countries (Slovakia and Czech Republic), categorize products, and create an interactive Power BI dashboard to gain insights into revenue, order trends, and product distribution.
Objectives
- Data Cleaning & Processing: Handle missing values, rename columns, and correct inconsistencies in data.
- Product Categorization: Assign product categories by joining orders data with product metadata.
- Country-Based Segmentation: Split the dataset based on country codes (CZ & SK) to allow localized insights.
- Data Aggregation: Summarize key metrics such as total revenue, total orders, and discount amounts.
- Interactive Dashboard: Develop a Power BI dashboard to visualize key sales trends.
Methodology
1. Product Categorization
- To categorize products, a SQL-based lookup was performed to map product names to their respective categories provided in the products table as reference to the orders and sales tables.
2. Data Processing with Python
- Dropped unnecessary columns to reduce redundancy and optimize processing.
- Standardized date format for consistency.
- Cleaned city names by removing numbers and applying title case formatting.
- Handled missing values by filling NaN values in the discount column.
- Renamed columns for consistency and esier work in Power BI.
3. Power BI Dashboard
- Visualized Total Revenue, Orders and Discounts through histograms for trend analysis.
- Created a line graph overlays number of orders to visualize demand fluctuations.
Key Insights
- Slovakia dominates sales: 243 out of 253 total orders come from Slovakia, indicating strong market penetration. The company has stronger market penetration in Slovakia. They should analyze marketing effectiveness in the Czech Republic and explore ways to expand into that market (localized promotions, partnerships, or ads).
- Collagen is the best-selling product: It accounts for 79.43% of total sales. The company should prioritize inventory, marketing, and R&D around Collagen-based products. If new products are introduced, they should be aligned with the Collagen product line since it resonates most with customers.
- Seasonal trends observed: Highest sales occur in Q4 2023 & Q1 2024, suggesting a peak in demand during winter months. This indicates a seasonal trend, suggesting that promotions or marketing campaigns should be ramped up during these periods.
- Discounts have a minimal impact on total revenue, suggesting that customers are not heavily influenced by discounts when making purchases. The company could test different discounting strategies to see if it significantly boosts sales.
Technologies Used
Python: Data cleaning, transformation, and aggregation (Pandas, NumPy)SQL: Product categorization via table joinsPower BI: Data visualization and dashboard creation
Conclusion
This project demonstrated the end-to-end data analysis workflow:
- Data Cleaning & Preprocessing (Python, SQL)
- Data Aggregation & Feature Engineering
- Power BI Dashboard Development
- Business Insights & Recommendations
The interactive Power BI dashboard allows for real-time exploration of sales trends, helping businesses make data-driven decisions. This project showcases the power of data analytics in making informed business decisions. By leveraging Power BI visualizations, we can transform raw data into actionable insights that drive business growth, efficiency, and market expansion. Moving forward, the company should continue monitoring performance metrics, experimenting with strategic initiatives, and adapting to customer preferences to maintain a competitive edge in the market.
SQL Code:
CREATE TABLE Products (
    product_id INTEGER PRIMARY KEY,
    product_name TEXT,
    category TEXT);

INSERT INTO products (product_id, product_name, category) VALUES
('...','...','...');

ALTER TABLE Orders_Python ADD COLUMN Product_Category TEXT;

UPDATE Orders_Python
SET Product_Category = (
	SELECT Products.category
	FROM Products
	WHERE Products.product_name = Orders_Python.'Item Name');
Python Code:
orders = pd.read_csv('Orders_New.csv')
orders.drop(orders.columns[[3, 4, 5, 6, 7, 9, 11, 12, 13, 14, 15, 16, 17, 18, 19, 35, 37]], axis=1, inplace=True)

orders['Order Date'] = pd.to_datetime(orders['Order Date'])
orders['Order Date'] = orders['Order Date'].dt.strftime('%d/%m/%Y')

orders['City (Billing)'] = orders['City (Billing)'].str.replace(r'\s\d+', '', regex=True)
orders['City (Billing)'] = orders['City (Billing)'].str.title()

orders['Discount Amount'] = orders['Discount Amount'].fillna(0)

orders.columns =orders.columns.str.replace(" ", "_")
orders.rename(columns={"Quantity_(-_Refund)": "Quantity"}, inplace=True)

desc_stat = {}

for col in orders.columns:
    if orders[col].dtype == "object":
        desc_stat[col] = {"Number missing": orders[col].isna().sum()}
    else:
        desc_stat[col] = { "Number missing": orders[col].isna().sum()}

def adjust_prices(row):
  if row['Country_Code(Shipping)'] == 'CZ':
    row['']

desc_stat = pd.DataFrame(desc_stat)
orders = orders.dropna()

Orders_grouped = orders.groupby(["Order_Number", "Order_Status", "Order_Date", "City_(Billing)",
                         "Postcode_(Billing)", "Country_Code_(Shipping)", "Payment_Method_Title",
                         "Cart_Discount_Amount", "Cart_Discount_Amount(inc._tax)",
                         "Order_Subtotal_Amount", "Shipping_Method_Title",
                         "Order_Shipping_Amount", "Order_Refund_Amount",
                         "Order_Total_Amount", "Order_Total_Tax_Amount"], as_index=False).agg({
    "Quantity": "sum"
})

Orders_grouped["Country_Full_Name"] = Orders_grouped["Country_Code_(Shipping)"].map({"SK": "Slovakia", "CZ": "Czech Republic"})

Orders_SK = Orders_grouped[Orders_grouped["Country_Code_(Shipping)"] == "SK"].reset_index(drop=True)
Orders_CZ = Orders_grouped[Orders_grouped["Country_Code_(Shipping)"] == "CZ"].reset_index(drop=True)